Table of Contents
Overview
- In this sample we will provide a Debug Environment for a WordPress Page heavily using Javascript
- The WordPress Page is using a Child Theme name twentyfifteen-child
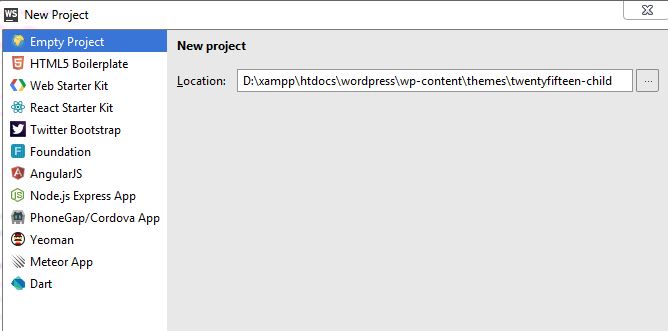
Create an empty Webstorm Project
- The Project Location point to the WordPress Child Theme where Scripts, Images are stored
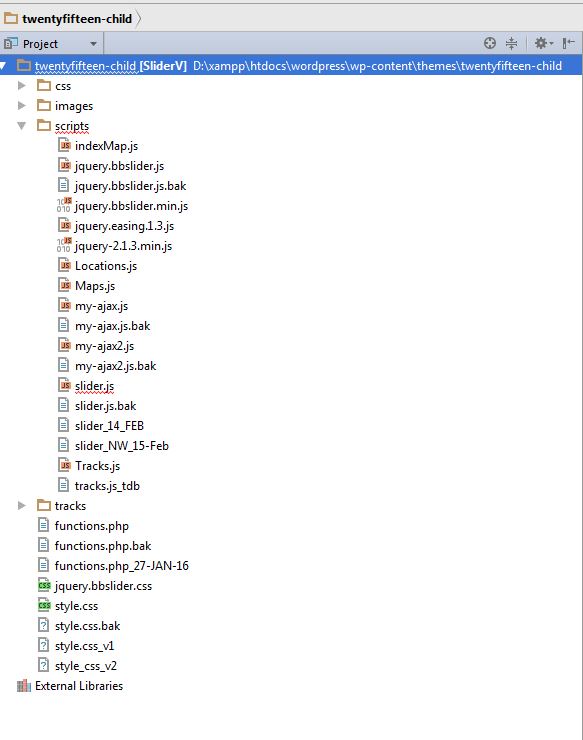
- Confirm that project directory is not Empty
- The Child Theme directory [ will all CSS, Images, JavaScript files ] should be displayed
Add the JavaScript Debug Session
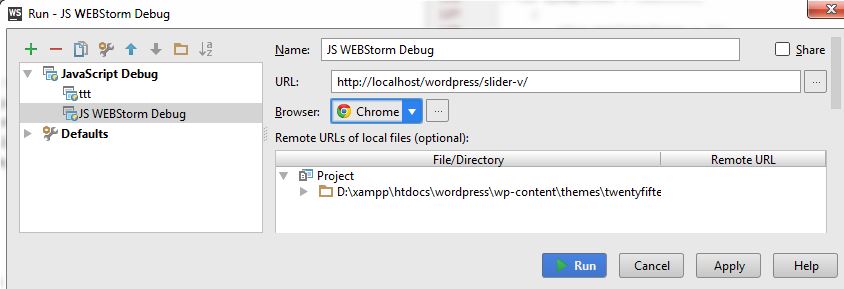
- Press Run -> Edit Config -> Select JavaScript Debug Session
- Provide a Session Name – here we use JS WEBStorm Debug
- Fill in the WordPress URL
- Select Chrome as the Default Browser
- Double check the Remote URL settings
- Press Run to Debug the JavaScript Code
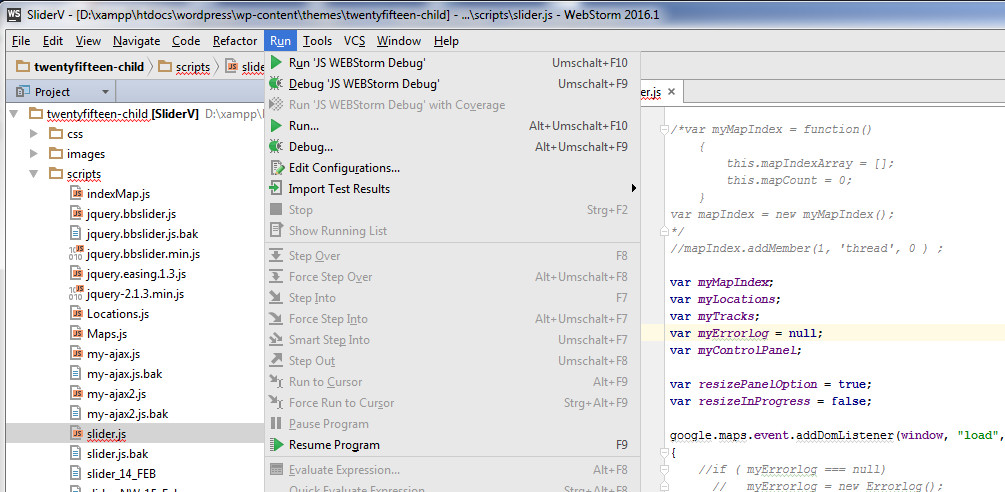
- At any time you cat rerun this Session from the Top Level Menu by selecting the session name : JS WEBStrom Debug
Invoke run method to load the WordPress HTML Dynamic Code and start F12 Debugger
- This should start the Chrome Browser
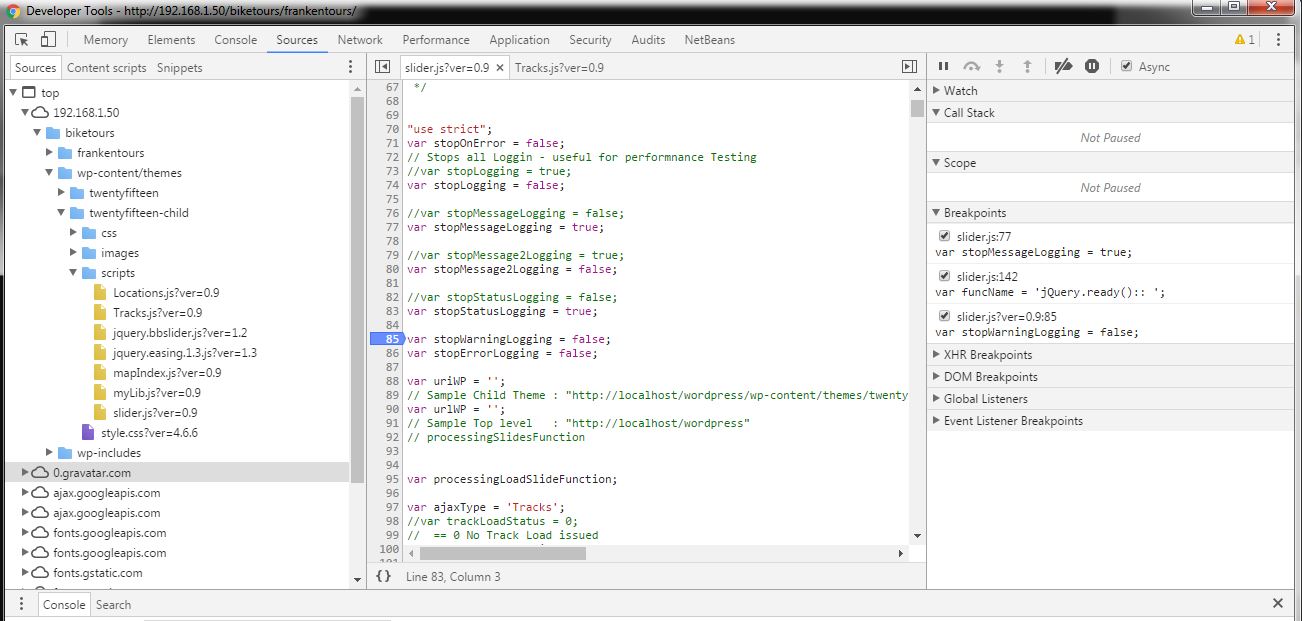
- Press F12 to start F12 Chrome Debugger
- Note the version number of our JS script files are set in functions.php

I prefer to use Codelobster to debug JavaScript code – http://www.codelobster.com